Elevating Wi-Fi Security: Navigating the Digital Age with Smarter Strategies
In today’s world, where digital connections are as vital as the air we breathe, the security of wireless networks can’t be taken lightly. With cyber
Whether your IT infrastructure is on premise, in the Cloud or hybrid, we are here to help.
The Cloud is here to stay, and now is the time to start your journey into this technology.
Find out more about the Essential Eight security model.
Our certified Engineers and IT consultants in Melbourne can prevent and fix a wide variety of hardware and software issues. You’ll also get professional advice on the right equipment and IT systems for your business which will help boost productivity.


Our vendor agnostic approach allows us to make the right decision for your business.
Performance and scalability is the key when selecting the IT infrastructure for your business.
Disaster recovery planning and testing is an essential part of any business, yet is often overlooked.
The right software applications act as a tool for your business to
achieve its goals.
The cloud is here to stay and now is the time to start your journey into this technology.
As a customer I am consistently satisfied with the results I get from the alltasksIT team. I have many variables to deal with inside my workplace infrastructure and the team is able to fulfill any of the requests I dish out to them. I rate their skill and customer support very highly.
ROHAN PENMAN – ADAIRS
Popular resources and information pages for products and services that can help your business achieve its IT goals.

In today’s world, where digital connections are as vital as the air we breathe, the security of wireless networks can’t be taken lightly. With cyber

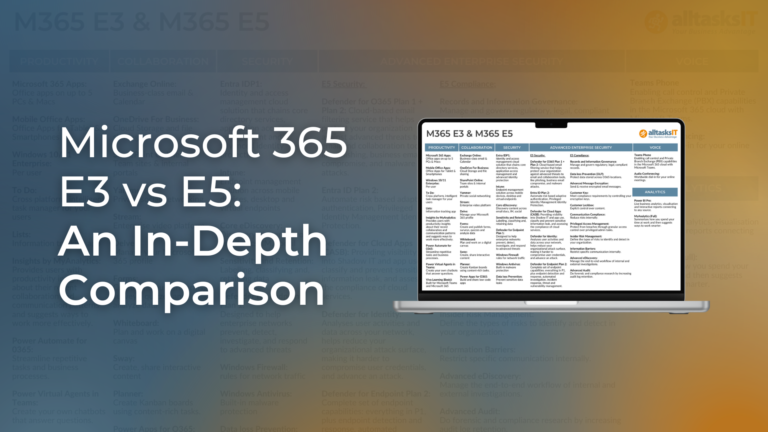
Empower Your Business with Microsoft 365 E5 Microsoft 365 E5 is the premium tier of Microsoft’s comprehensive suite of productivity and collaboration tools. It includes

Password Managers, In our digital age, where every click, swipe, and login leaves a digital footprint, safeguarding our online presence has become paramount. Yet, many