

alltasksIT has supported businesses nationwide for over 30 years, from small businesses to large enterprises, from 10 computer businesses to large multinational networks; we have monitored, managed and maintained networks that our customers rely on to stay alive.
This article is for Systems Administrators, IT Managers, CIOs, CDOs, Web Developers, Programmers, and current or future customers who co-manage environments with us—you need SolarWinds Observability, and you need it yesterday.
In 2024, we investigated what we could be missing and what our customers were missing.
Was there a chance we’d miss an important systems performance degradation?
What makes us the typical MSP?
What makes us remarkable?
That soul searching, and our team sitting down looking at every system, every application, every button click we and our customers could make, led us to develop a new offering that goes way above and beyond anything any MSP has ever done before.
We introduced Observability to our customers.
This article discusses how we’ve transformed our business to go well above and beyond what you’d expect from a traditional Managed Services Provider by partnering much deeper with SolarWinds on their industry-leading and cutting-edge SolarWinds Observability platform.
While we will go deep in this series of articles in the coming weeks and months, this article is also designed to standalone showing you what you need to know to get started.
Let’s start with the facts.
Traditional MSP monitoring usually involves essential, cost-effective tools that catch significant issues for 95% of customers. That’s fine for many businesses—but it doesn’t tell you why things break, only that something’s gone wrong.
Traditionally, monitoring tools can’t see into your ISP’s internet to spot deep, complex network faults.
Traditional monitoring tools can’t tell you if your website is performing if people are staying on your website or abandoning your carts, or if it’s a database problem for why you’re e-commerce platform is not returning the expected investment
Traditional monitoring tools don’t back up critical infrastructure configurations.
Traditional monitoring tools aren’t providing AI-driven root Cause Analysis of complex, multifaceted issues to (hopefully prevent) help fix issues before they become catastrophes.
Indeed, no traditional monitoring solution does this all in the fabled “single pane of glass”.
So, we looked at what can’t happen with traditional tools and went deeper.
At alltasksIT, we’ve always believed in going deeper. That’s why we’ve partnered with SolarWinds Observability: it’s a next-level monitoring platform that gives us (and you) complete visibility into everything from user behaviour to application performance. In other words, it shows us why things aren’t working, not just what is broken.
For decades, enterprise-grade monitoring suites like SolarWinds came with huge price tags—think $50,000 or more for mid-sized businesses. You used to have to license SolarWinds’ or other vendors’ monitoring platforms for your entire business and all its assets.
You used to license monitoring tools to look after one part of your business, your network, your servers, and your applications, but never all of it all at once, and if you did, let’s go back to that price tag. Can you afford a full-time salary on a tool to monitor everything?
Understandably, many MSPs and Solution Integrators like us avoided these tools; they weren’t multi-tenanted, every customer had a unique deployment, and we couldn’t see all our customers in one pane of glass, and they were JUST monitoring solutions.
So we’ve spoken a lot about what monitoring is, but what is observability?
Monitoring tells you at a point in time that something is wrong. The red light engine warning, the sound of the engine rattling.
Observability tells you exactly where in the engine something is going wrong and why.
It’s that simple, but the execution of observing that level of componentry is difficult, and traditionally expensive.
Not anymore.
SolarWinds Observability is a comprehensive SaaS platform that monitors everything in your environment—websites, on-premises servers, cloud applications, custom code, database performance, and even your user’s experience on your site or app, by understanding the why behind issues, we can solve them faster (and often before they become big problems).
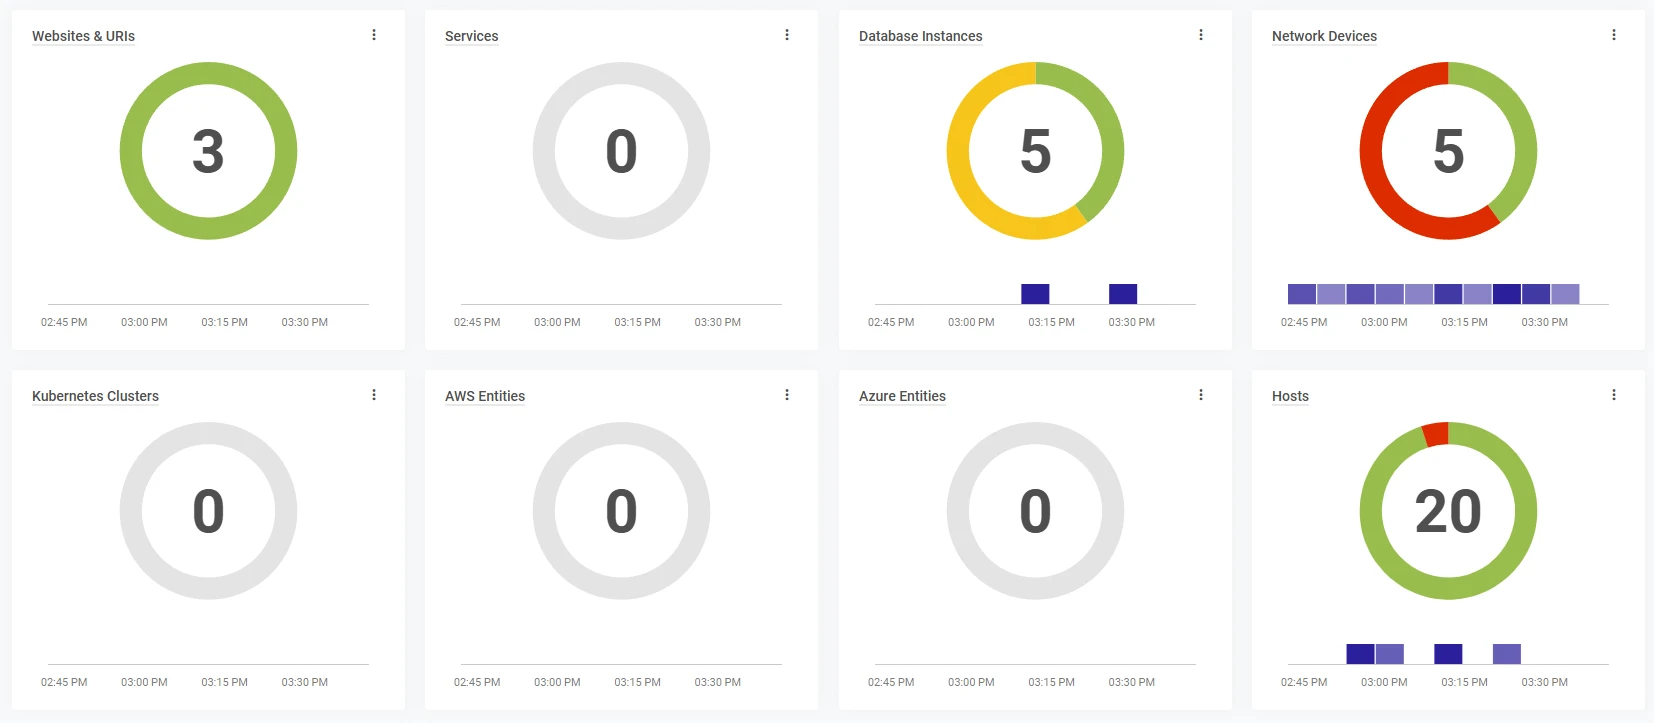
Even the first screen when we log in delivers immediate value and shows you data you probably aren’t getting from your existing monitoring tools.
Imagine starting your day by seeing this and knowing exactly what to focus on. Better yet, imagine getting alerts to your phone, to your Microsoft Teams, or Slack that there are alerts you need to hop onto so your outages are resolved before staff start rolling in for the day.
Imagine being able to point to a database issue that your application developer is responsible for and you’re “just the network guy” who can’t fix database issues. You’ll start to see as we go down through these modules time to value in this platform is immediate.
How are we using SolarWinds Observability?
Great question, we are leveraging all of the modules available in the platform. For any service we host, any code we write, and any website we’ve built and maintained, we’ve deployed SolarWinds Observability to give us deep insights into the services we provide for our customers that rely on. The summarised version of our deployment can be seen below.
This lets us detect performance bottlenecks, track usage patterns, and nip problems in the bud—often long before they reach your end users.
We also deploy some or all of this for customers and they manage the journey, we are just here to continually challenge what we see but our customers consume the platform while we do proactive maintenance – there’s no better co-managed tool for this outcome.
We use the platform to gain awareness he’s using it, and we can Nudge him to ask him to provide more information about the platform so we can continue to support it, or block it and find a safer alternative.
Below, we break down each central module in SolarWinds Observability. Over the coming weeks, we’ll share short videos and real-world examples of how we’ve deployed these modules to help our customers save time, money, and (most importantly) headaches.
DEM focuses on what users see and feel when interacting with your apps and websites. It combines availability checks, accurate user monitoring, and synthetic transactions to give you a 360° view of how well (or poorly) things are running from the user’s perspective.
Picture this: you’re a retailer juggling hundreds of transactions per hour—until your site slows to a crawl. Pages lag, customers bail on their carts, and your support team scrambles. When you notice the issue, you’ve lost thousands in sales and given frustrated shoppers a reason to head straight to the competition.
That’s where Digital Experience Monitoring (DEM) comes in. Instead of waiting for alerts or outraged tweets, you see performance dips and downtime as they happen, tackling them before they tank your revenue. Real User Monitoring (RUM) captures visitors’ exact experience on your site—pinpointing slow pages, browser hang-ups, and checkout glitches. If abandoned carts suddenly spike, RUM helps you find—and fix—the root cause.
Then there are Synthetic Transactions, which continuously simulate the user journey, from browsing products to processing payments. A broken step triggers an immediate alert so that you can respond in seconds, not hours. The result? Fewer lost sales, happier customers, and a healthier bottom line. DEM isn’t just about tracking metrics; it’s about keeping your online business running like a well-oiled machine—no matter how busy things get.
Digital Experience Monitoring gives you an up-close look at what your customers see when they use your services. Instead of hoping your site loads fast, you’ll know for sure—and you can fix any hiccup before it impacts your sales or reputation.
Maybe you’re the Sys Admin and do some web development. Maybe you’re getting calls about a slow website and must pass them on to your web developer. The rich information you receive from Digital Experience Monitoring will improve everything there is to improve about what you’re customers see of you online
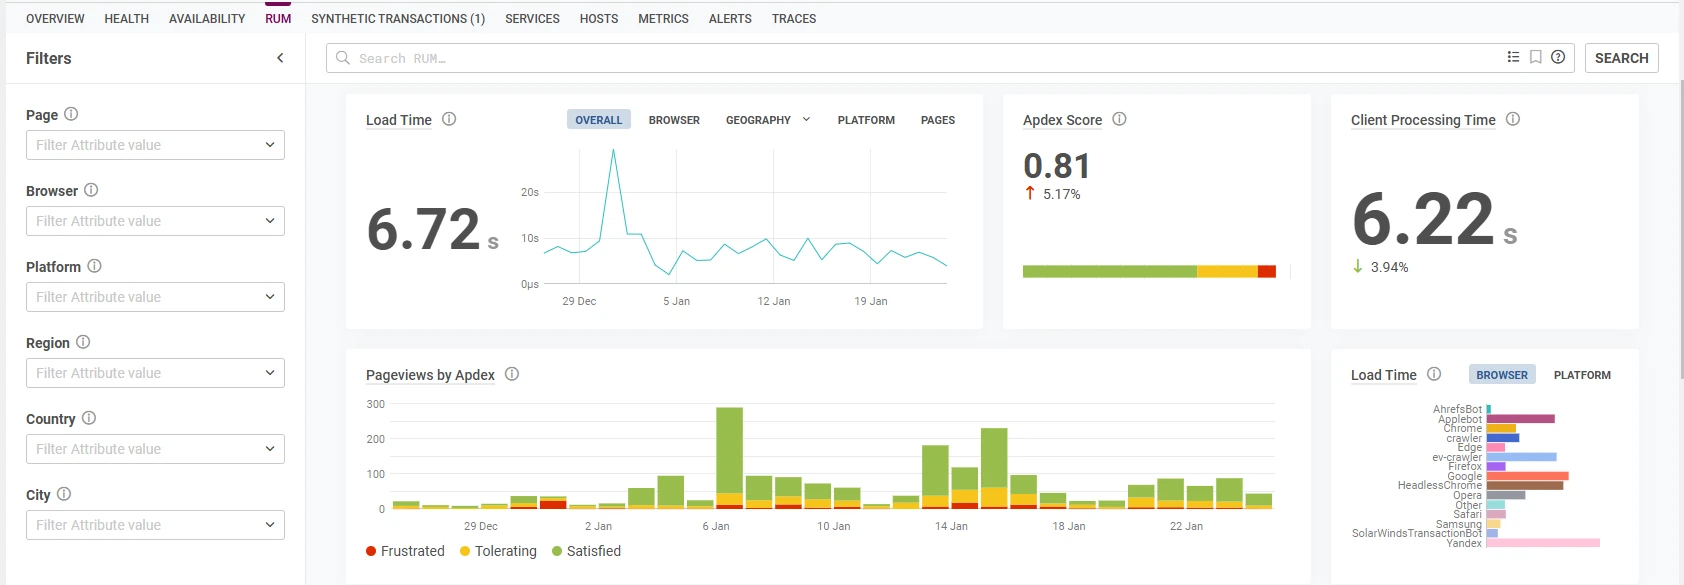
What if you’re an international business? Your Australian customers are really happy with your service, but over in the UK, the experience is different. Your Net Promoter score is different, and sales are down. With DEM, you’ll see where your customers are coming from worldwide; maybe it’s time to split off your website to different geographic locations or move it to a CDN. Abandoned carts are lost sales, after all.

Would you like to know which parts of your website customers are attracted to? Or how long do they stay on your page? Are they bouncing after looking at only one page? You’ve guessed it. DEM gives you those answers. How many new visitors are there to your website? What is catching their attention? What makes you unique? The insights this platform gives, are beyond anything we’ve seen for the price point we are seeing it at.


APM dives deep into the code of your custom or off-the-shelf applications. It tracks response times, error rates, and database queries—all in real time.
Imagine your in-house payroll app grinding to a halt every Friday.
Employees can’t log hours, finance scrambles to meet deadlines, and everyone’s frustrated.
Application Performance Monitoring (APM) zeros in on the exact function or database query, causing the slowdown. With robust error tracing, you spot the culprit in minutes, not hours—perhaps a stuck query or rogue line of code. As a result, your team can fix the problem before it affects everyone else. Faster apps mean happier users, fewer outages, and a more efficient workday.
Our customers who have in-house applications and developers especially love APM. It provides a clear picture of where their app’s resources go, helping them tweak performance, reduce crashes, and give users the snappy experience they expect.
If you’re a developer, can you currenty log in to a single source of truth to see your mission critical applications alongside your organisations other infrastructure to know if it’s the application, or the network? Screenshots like the one below highlight the importance of this sort of visibility

And when it’s time to go deep, SolarWinds Observability has you covered. With metrics, traces, and logs, you can exercise your god given talent of making applications perform and stay available to your organisation and customers, no matter how monolithic or ephemeral the workloads are.
Let’s suppose you’re a developer responsible for orders on your websites being processed. You know that people will abandon cart if they don’t have a good experience. Do you know how long orders are taking from the time someone goes to check out? You do now with SolarWinds Observability. Check out the screen below. This shows a healthy website with great response times, but when it goes wrong, you’ll see red, red, red.

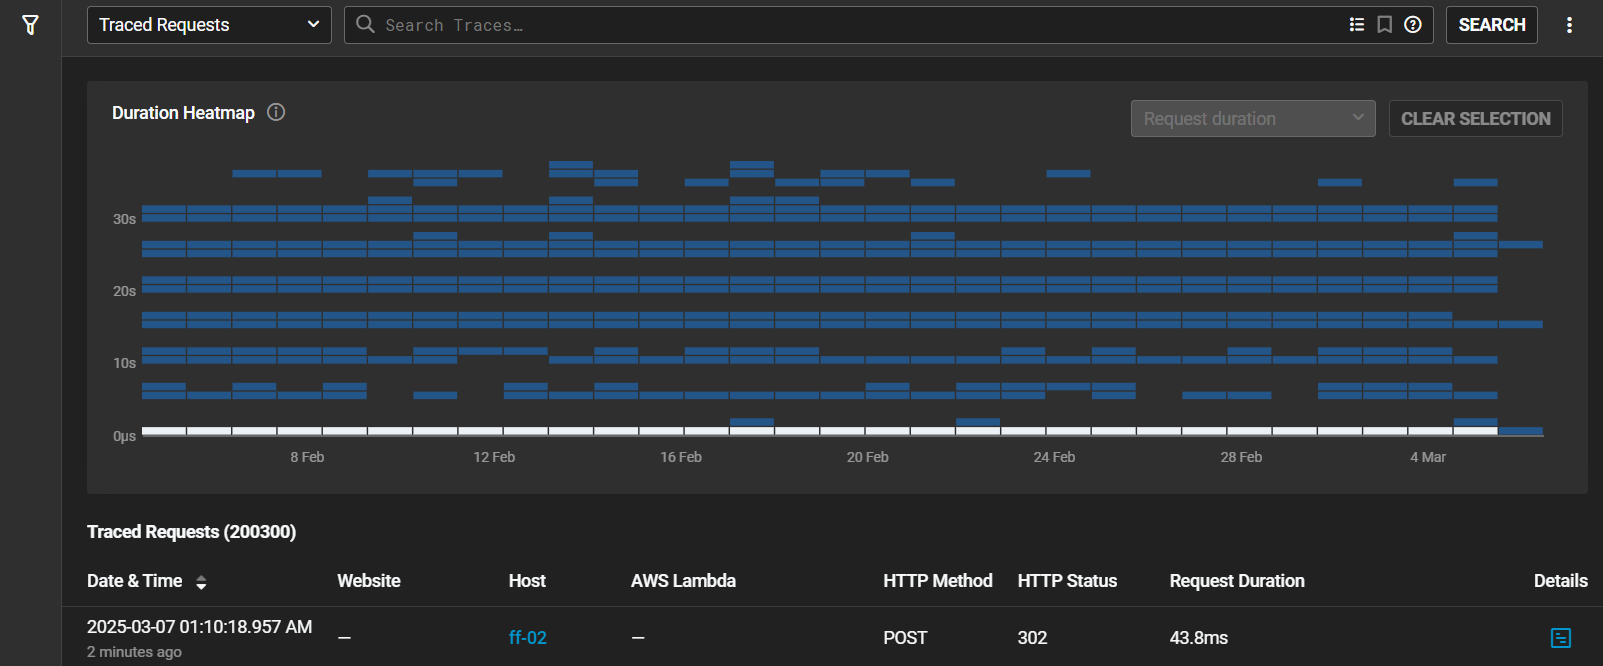
You can pull yourself out of the weeds really quickly here too with 30 day history showing a heat map of when issues are occuring. In our example our services are all blue, but imagine a scenario where you see “red” at 3:00PM every day, and you aren’t sure why, you can use the cursor to dive a lot deeper on the time of day that things are going wrong and get to root cause quicker than ever.
Picture an online retailer handling massive holiday traffic: thousands of customers searching for deals, adding items to their carts, and checking out all at once. If a database query bogs down, site performance tanks and carts are abandoned, and sales plummet. With SolarWinds Observability Database, you’ll spot these slow queries and resource choke points in real-time, fixing issues before they become profit-killers.
Beyond performance, robust data visibility lets you plan for growth. You know when to scale up CPU, memory, or storage so your database never becomes a bottleneck. Plus, with built-in security and auditing tools, you can catch suspicious activity early, safeguarding sensitive customer information. The result? A seamless customer experience, healthier bottom line, and fewer late-night crises for your IT team.
Or imagine your in transport and logistics, and you’re national fleet of trucking equipment reports telemetry data about the health of your fleet daily, weekly, and monthly. It’s the end of the month, and an executive runs a report database that stores this information to see how profitable each travelled route is. The query takes a few hours to run and locks the database up. Your users are calling, screaming they can’t use the application anymore because it’s broken. Your team calls the developers, and they spend 24 hours troubleshooting the issue, and the issue is no longer there because the report finished running, and everything went back to normal. None of the servers was under pressure; everything was normal, but now you have to do a post-incident review for the same boss that caused the problem in the first place.
Database Observability shows this sort of data in great detail. What queries are slowing you down? What errors are happening at a database level that are causing your application to fail?
As IT persons, we are often siloed. I’m the network person, you’re the database person, that guy over there, he’s our application support person, Shelly is in that corner office, and she runs our servers. Are you all talking? You all rely on each other’s expertise but none of you have a common platform with a single pane of glass pointing the EXACT cause of the users that are flooding your service desk with calls.
Imagine a DBA speaking the same language as a Network Engineer.
We are getting geeky now, but it really is possible with SolarWinds Observability.
A hungry query will kill your database and application performance. In the example below you’ll get to root cause quickly. You don’t have to be a DBA to understand what you’re seeing, you might not even own the service, but you CAN now see where problems and are address them in real time with the people responsible for those services.
We hear this a lot. A Sysadmin always copping the blame for a slow application or network. The reality of a modern business is that you have enterprise applications in your business where the third party supports them – so when your users call you expecitng answers, you don’t have them, what do you do? You gather gigabytes of logs and forward them on. The vendor gets back to you saying “Thanks for the logs, can you do this thing you’ve already done 1,000 times?” Because it couldn’t possibly be the app right? All applications are perfect and you as a sys admin don’t know anything, John Snow. But you do now, you have SolarWinds Observability.

Imagine you’re an online retailer who suddenly experiences a massive slowdown mid-sale event. Customers can barely browse your site, and orders drop to a trickle. SolarWinds Observability’s Network solution, and for example, NetPath, lets you see each hop in your network route—from your on-prem router to your cloud provider—pinpointing exactly where traffic is bottlenecked or failing. Maybe a regional ISP is down, or your firewall’s misconfiguration is the culprit. With that visibility, you can swiftly reroute traffic or fix settings before frustrated customers head elsewhere, or at the very least, have a more nuanced conversation with your telco about why network access to critical business resources is slow or failing.
NetPath is a tool every IT person should have in their bag of tricks. It’s saved us more times than we care to admit.

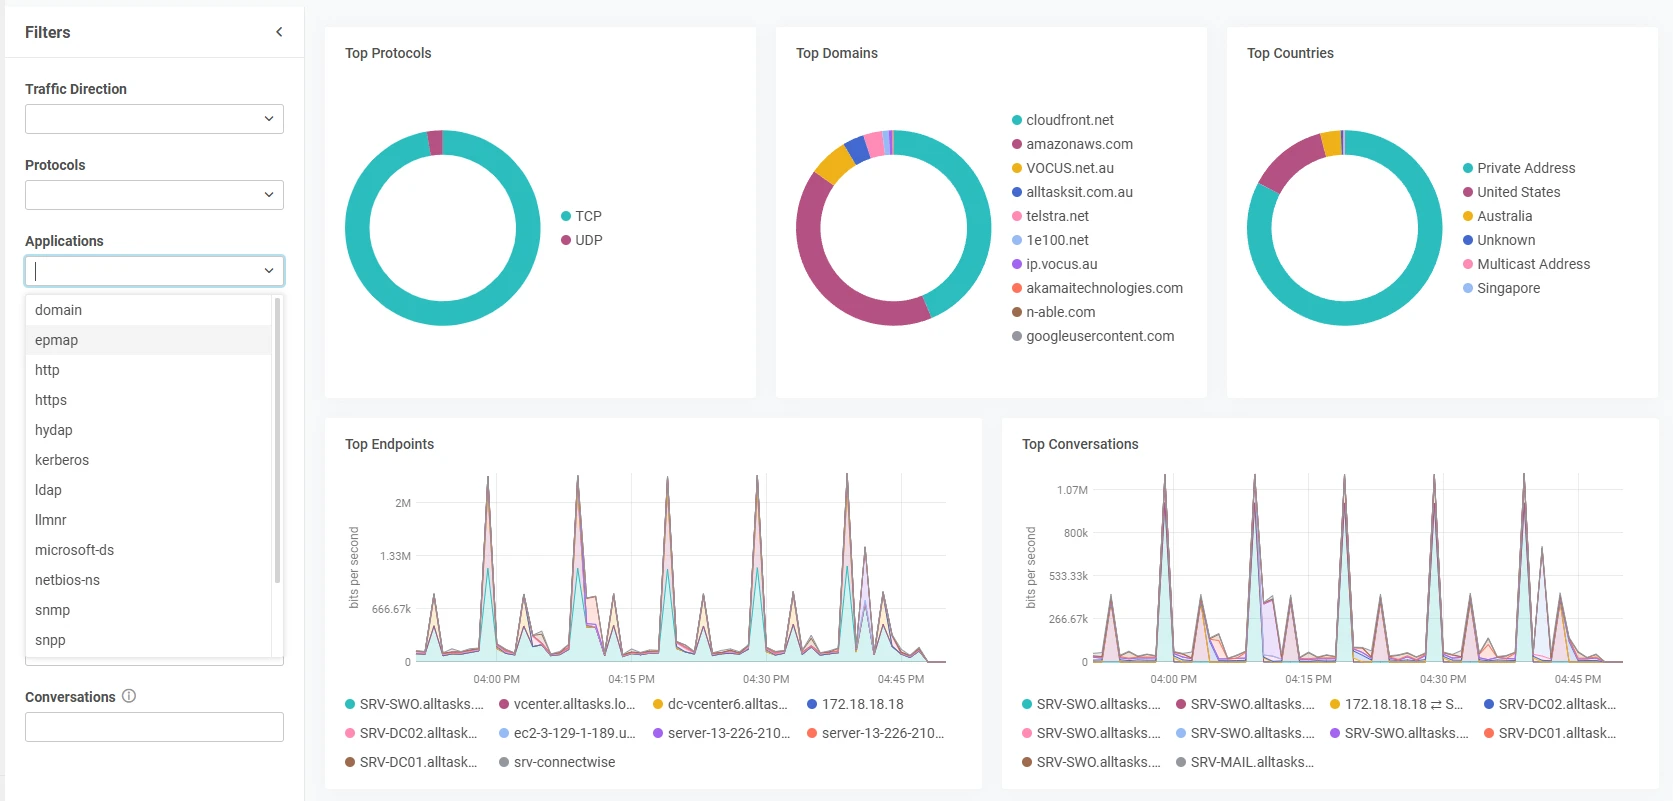
Meanwhile, NetFlow Top Talkers reveals which devices or apps devour bandwidth—be it your marketing team uploading massive video files or a suspicious surge from overseas IP addresses. If you spot strange network spikes from a known Russian threat actor, you can lock down your firewall or block specific IP ranges on the spot. And if a recent firmware update caused a glitch, Configuration Management lets you restore your router or switch to a stable config in minutes, preventing hours of guesswork and potential downtime.
NetFlow alone is worth the price of admission into SolarWinds Observability. NetFlow used to be expensive when you hosted it on-premise. It was expensive because you’d have millions of rows of data to analyse on limited internal server resources. You don’t need to worry about that anymore, let these charts do the talking and SolarWinds crunch those numbers.
All of this adds up to fewer network meltdowns, less time spent on frantic troubleshooting, and the peace of mind from catching threats early—whether that threat is a misconfigured port, a bandwidth hog, or a hacking attempt half a world away.
Your network is the backbone of your business. With SolarWinds Observability, we can pinpoint precisely where a slowdown or outage is happening—sometimes even before it happens—ensuring your team stays connected and productive.
And this is all just scratching the surface of Network Monitoring and SolarWinds capability. The key takeaway above all else here is that you can start small. Why not monitor your core network alongside your website, database, and top 10 critical assets? It’s easier to prove the need for this in your tool kit when you have data to justify additional expense. These charts are there within hours of clicking “deploy” with SolarWinds Observability. Get started by reaching out to us for a demo and discussion.
This is where we’ll leave part one of this blog series. We’ll leave you with recaps and take aways.
In this first part of our deep dive, we explored why we chose SolarWinds Observability and how it transformed our approach to IT management. We discussed the limitations of traditional monitoring versus the power of full observability. You learned how SolarWinds Observability gives you actionable insights across multiple layers—from digital experience and applications to databases and network traffic—empowering us (and you) to diagnose not just that something’s wrong, but exactly why.
Holistic Visibility: SolarWinds Observability provides a comprehensive view across your entire IT environment.
Beyond Alerts: It not only notifies you of issues but also pinpoints their root causes.
Digital Experience Monitoring (DEM): Gain detailed insights into user interactions and performance issues in real time.
Application Performance Monitoring (APM): Dive deep into your code to quickly identify and resolve performance bottlenecks.
Database Observability: Monitor queries and resource usage to prevent performance slowdowns that can impact sales.
Network Monitoring: Identify and address network bottlenecks with tools like NetPath and NetFlow.
Cost Efficiency: Achieve enterprise-level monitoring without the hefty price tag of traditional solutions.
Single Pane of Glass: Consolidate all your monitoring needs into one intuitive dashboard.
Proactive Management: Catch potential issues before they escalate into full-blown outages.
Enhanced Collaboration: Break down silos by providing clear, actionable insights that speak a common language for IT, development, and operations
In the next post we are going to talk about Infrastructure Monitoring, Log Management, and what’s coming next in our upcoming series of videos and articles—so stay tuned for more actionable insights!
At alltasksIT, our goal is simple: give you clear, actionable insights into your entire IT environment so you can focus on what really matters—growing your business. By moving from traditional monitoring to full observability with SolarWinds, we’re excited to help you tackle challenges before they become problems.
SolarWinds Observability is the answer if you’re ready to break free from surface-level alerts and gain deep insight into your tech stack. Stay tuned for our upcoming articles and 90-second videos where we’ll show you exactly why it’s a game-changer—and how easy it can be to get started.
Thanks for reading, and we can’t wait to share more of our hands-on experiences soon!

Chief Customer Officer
Mark Boyd is a Chief Customer Officer (CCO), plays a key executive role responsible for overseeing the entire customer experience within alltasksIT. The CCO serves as the voice of the customer at the highest levels of the company, ensuring that customer-centric strategies are developed and implemented across all departments.